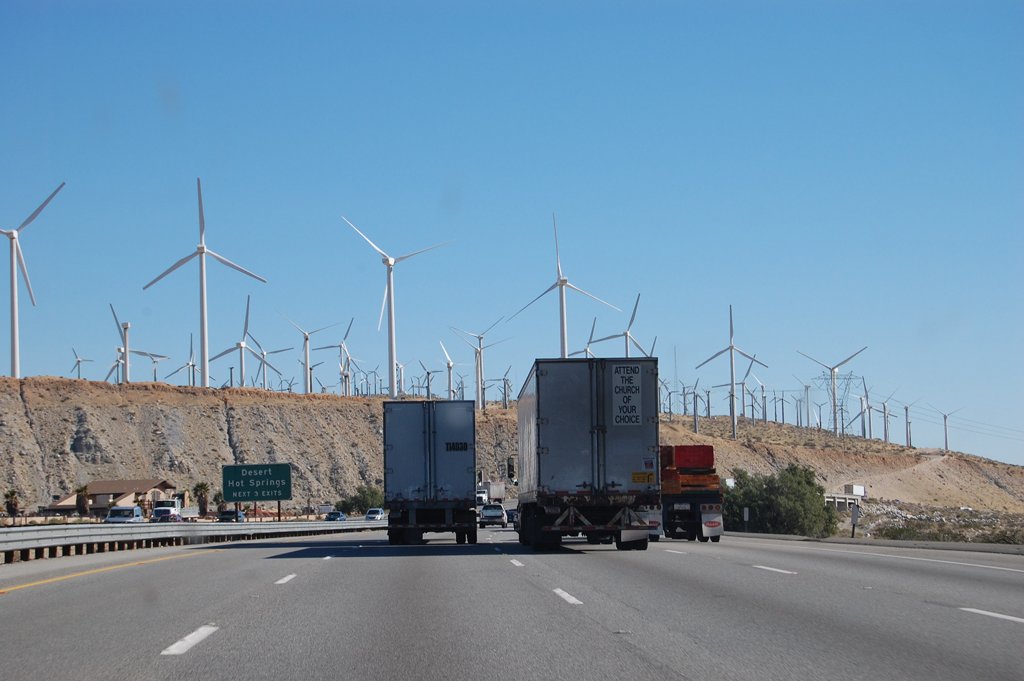
 Dear readers and visitors of the OliNo.org website, I would like to share another part of my experience as a Dutch visitor, when I was travelling in the warm and deep South of the USA during October until January of 2009. In January I was riding on interstate highway 10 between Whitewater (CA) and North Palm Springs (CA) I passed a windmill farm: a beautiful sight with a large number of propellors forming a visual show in the sky. I did a little investigation about numbers and megawatts.
The San Gorgonio Pass wind farm
The pass is one of the windiest places in Southern California, and is one of three major wind farms in California, along with the Altamont Pass Wind Farm and the Tehachapi Pass Wind Farm. As of January 2008 the farm consists of 3,218 units with 615 MW (megawatt) of installed wind power capacity. It is the seventh largest wind farm in the USA.
Since most of these facilities were installed in the early 1980s – during the so called Californian Wind Rush – the majority of the of the operating wind turbines is smaller than 200-kW. These older and smaller turbines are considerably less efficient than the later installed turbines, which have higher capacity factors and are more economical.
According to the American Wind Energy Association, the production in the San Gorgonio Pass in 2006 was 732,561,714 kWh with an installed capacity that year of 565 MW. This is 14% of its capacity (from a high in 2002 of 19.5%) and this capacity factor is quite low compared to averages of 25% and even 37% of wind farms at sea. The cause is not investigated here but it is either due to lower wind speeds or higher levels of maintainance and drop-outs.
Despite all of this, the San Gorgonio Pass has proven to be a reliable location for wind energy production. This is due to stable wind flows caused by warm desert air mixing with cooler coastal air, producing average wind speeds of 15 to 20 mph. San Gorgonio is unique in that winds generally are strongest during the summer months, when electricity demands are at their highest.
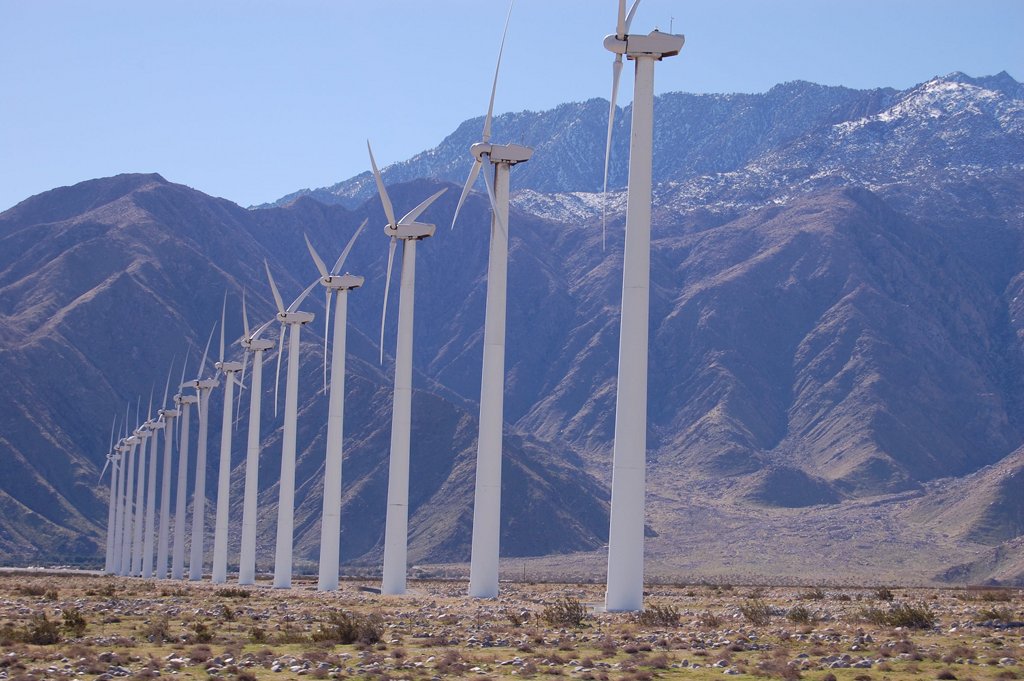
San Gorgonio Pass wind farm (photo: Dirk-Jan de Wilde)
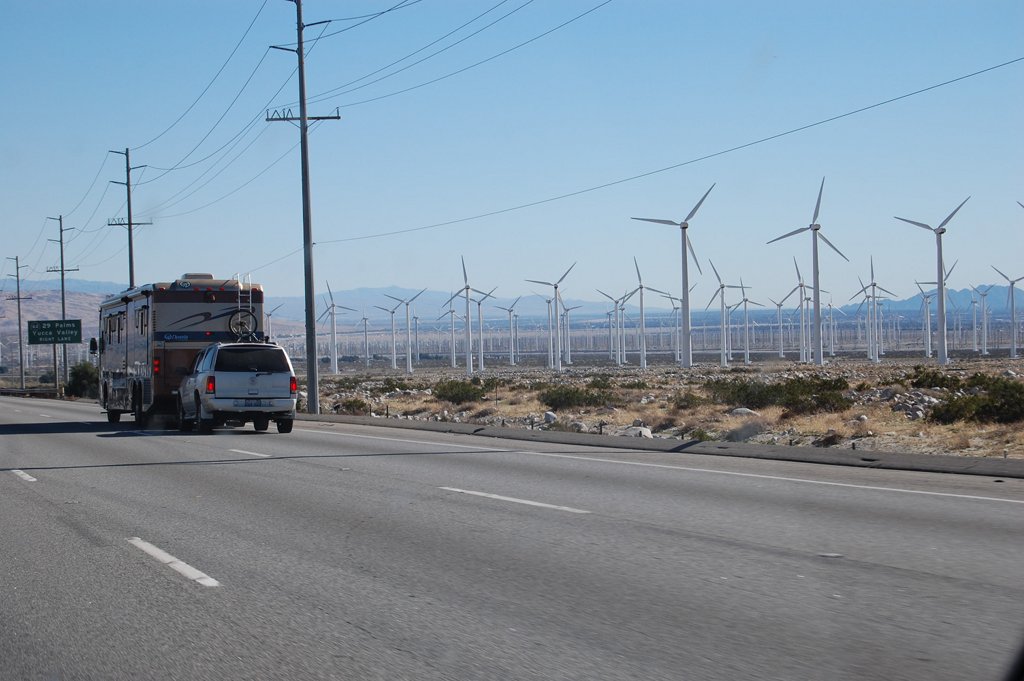
Wind farm seen from interstate 10 (photo: Dirk-Jan de Wilde)
Wind energy in California
In 2007, all turbines in California wind farms generated 6,802 GWh (gigawatt-hours) of electricity – about 2.3 percent of California’s gross system power.
Within the USA, California at present time ranks number three as state in terms of installed wind power capacity having 2,517 MW. Iowa is number two with 2,790 MW and Texas number one with 7,116 MW.
Note: for extra information about MW and MWh/GWh see the blue colored box below.
Renewable energy in California
In 2007, 11.8 percent of all electricity in California came from renewable resources such as wind, solar, geothermal, biomass and small hydroelectric facilities. Large hydro plants generated another 11.7 percent of our electricity.
Who is wind power number one in the world?
The USA passed Germany to become the number one market in wind power. But when looking at the European Union as one market, the EU is by far the world leader in terms of installed wind power.
| Installed wind power capacity in 2008 | |
|---|---|
| Market | MW |
| EU | 65,085 |
| USA | 25,170 |
| China | 12,210 |
| India | 9,645 |
| Canada | 2,372 |
| Japan | 1,880 |
| Austrialia | 1,306 |
| Brazil | 341 |
| World total | 120,798 |
What about wind power penetration levels?
At present, few grid systems have penetration levels of wind energy above 5%. Denmark values over 19%, Spain and Portugal over 11%, Germany and the Republic of Ireland over 6%, all these states being member of the EU.
In the USA, in 2008, wind generated 52 million megawatt-hours (MWh) representing 1.26% of all generation. This was a 51% jump in generation compared to the 34.5 million MWh generated in 2007, which was 0.83% of all generation. Under a 20% wind penetration scenario in the USA by 2030, installations of new wind power capacity would increase to more than 16,000 megawatts per year by 2018, and continue at roughly that rate through 2030. A total of 300,000 MW of land based and offshore wind power capacity would have to be installed to meet that level of electricity production.
Number of households per MW
One megawatt of wind capacity is enough to supply 240 to 300 average American homes.
Note that American households have the highest energy consumption in the world. So, the number of European or Chinese households that can be supplied per MW are higher.
Price per kWh
With current wind research and development efforts, California’s Energy Commission estimates that the cost of wind energy can be reduced from its current 8 cents to 3.5 cents per kilowatt-hour, with the availability of newer technologies and low interest long term financing continues to be available (as been approved in US budget). In comparison, the current price for coal generated electricity is approx. 5 cents and for nuclear approx. 8 cents per kilowatt-hour.
Note that these prices are related to generation of energy and ignore costs for instance to store CO2 (when coal powered) or nuclear waste (when nuclear powered). In this situation wind energy even becomes more attractive.
Global wind energy forecasts
According to forecasts of GWEC (Global Wind Energy Council, Brussels, EU), in 2013, global wind generating capacity will stand at 332 GW, up from 120 GW at the end of 2008.
Europe will continue to have the largest installed capacity up to 2013, closely followed by Asia. It is expected that by 2013, the total capacity in Europe will stand at 118 GW. At the end of the period under consideration, large scale offshore developments will start to have an impact on growth rates in Europe, and this will lend new momentum to developments in the following years. Signs that things are changing and that this region could hold some big surprises over the next five years.
Asia is expected to be the fastest growing region in the world as of this year, driven mainly by China, which has been doubling its installed capacity every year for the past four years. Asia’s cumulative wind capacity is expected to be up to 117.4 GW by 2013, on a par with the expected capacity of Europe by that time.
References
The interested reader can check the following links for more info:
San Gorgonio Pass Wind Farm
Overview of wind energy in California
Renewable energy in California
Statistics of wind industry in the USA
List of wind farms in the USA
Wind power in the United States
GWEC’s Global Wind 2008 Report
AWEA Annual Wind Industry Report year ending 2008
Dirk-Jan de Wilde
Eindhoven, the Netherlands
To relieve some of the confusion around ‘watt’ and ‘watt-hour’: installed wind capacity is expressed in ‘watt’ (for instance ‘megawatts’) while actual delivered energy is in ‘watt-hour’. In this article mostly watt is used (i.e. installed wind power) because the actual generated power in terms of watt-hour are not available and difficult to calculate because they depend on factors such as wind speeds but also propellor wingspans and propellor heights.


July 24th, 2009 at 8:40 am
This comment is beside the point but thought I would share anyways. Your statement.
“…when I was traveling in the warm and deep South of the USA during October until January of 2009. In January I was riding on interstate highway 10 between Whitewater (CA) and North Palm Springs (CA)”
California is in no way considered to be “the deep South” here in the USA. Something I didn’t understand growing up in Texas. I thought I was (Texas) a part of the deep South being that our state is along the Southern border.
Only after living in TX, GA, TN and CA have I learned that the South is considered these states: http://upload.wikimedia.org/wikipedia/commons/a/a3/US_map-The_South_Modern_.png
Although this map includes Texas and Oklahoma I disagree those should be removed in my opinion. The South also has some cultural features that set it apart, for example the food and drink served at restaurants.
The surefire way to know if you are in the South? Go out to eat, ask for Sweet Tea to drink. (a cold beverage) If they serve it you are in the South, or the restaurant has roots in the South. (the fast food chain Chic-fil-a, originally from GA, is the only chain that serves Sweet Tea in all their franchises across the USA that I am aware of)
Soooooooo, all that to say calling any part of CA “the deep South” is not correct but does confirm that you live in another country. One I would like to visit I might add.
enjoying the content on your site!
March 9th, 2011 at 5:12 pm
[…] compared with breeze farms like that of a San Gorgonio Pass, in California, that has historically delivered some-more than 700 million kilowatt hours a year. But if cities start trace trees here and there, they’ll be giving their appetite […]
September 6th, 2011 at 12:24 pm
[…] compared with wind farms like that of the San Gorgonio Pass, in California, which has historically delivered more than 700 million kilowatt hours a year. But if cities start sprinkling trees here and there, they’ll be giving their energy […]