Lagotronics – DecaLED Panel White Shades 595x595mm (3x)
Posted by Marcel van der Steen in Light measurements No Comments» Lagotronics presents an LED panel. The measurements from OliNo show that the lamp emits a neutral white light with a color temperature of 4314 K. The lamp consumes 68.6 W and has a luminous flux of 6228 lm. This results in an efficacy of 91 lm/W. The lamps energy category label is A+. Panel is measured with all LEDs on (both 3000 K and 6000 K). Also Eulumdat files are present for the cases of only 3000 K and only 6000 K on.
This article shows the measurement results. Many parameters are also found in the Eulumdat file.
See this overview for a comparison with other light bulbs.
Summary measurement data
| parameter | meas. result | remark |
|---|---|---|
| Color temperature | 4314 K | neutral white |
| Luminous intensity Iv | 2140.9 Cd | Measured straight underneath the lamp. |
| Beam angle | 113 deg | 113 deg is the beam angle for all C-planes since the lamp is symmetrical along its 1st axis. |
| Power P | 68.6 W | The net power consumed. |
| Power Factor | 0.95 | An electrical load with this power factor means that for every 1 kWh net energy consumed, there has been 0.33 kVAhr for reactive energy. |
| THD | 5 % | Total Harmonic Distortion. |
| Luminous flux | 6228 lm | Measured with photogoniometer, calculation done as described in LM79-08. |
| Luminous efficacy | 91 lm/W | |
| EU2013-label classification | A+ | The energy class, from A++ (more efficient) to E (least efficient). This label is an update of the previous version, and compulsory from Sept 2013. |
| CRI_Ra | 86 | Color Rendering Index. |
| CQS | 83.7 | QCS (v9.0.3) is an improved indicator (over CRI) of how well colors are rendered. |
| Coordinates chromaticity diagram | x=0.3590 en y=0.3656 | |
| Fitting | 230V | This lamp is connected via an external power supply to the grid voltage. |
| PAR-value | 20.5 uMol/s/m2 | The number of photons seen by an average plant when it is lit by the light of this light bulb. Value valid at 1 m distance from light bulb. |
| PAR-photon efficacy | 0.9 uMol/s/We | The total emitted number of photons by this light, divided by its consumption in W. It indicates a kind of efficacy in generating photons. |
| Photon current | 94.6 uMol/s | The total number of photons in the light of this lamp. |
| S/P ratio | 1.9 | This factor indicates the amount of times more efficient the light of this light bulb is perceived under scotopic circumstances (low environmental light level). |
| L x W x H external dimensions | 595 mm x 595 mm x 50 mm | External dimensions of the lamp. |
| L x W luminous area | 520 mm x 520 mm | Dimensions of the luminous area (used in Eulumdat file). It is the white surface at the front through which the light comes out. |
| General remarks | The ambient temperature during the whole set of illuminance measurements was 23.1 – 24.6 deg C.The temperature of the lamp gets maximally about degrees hotter than ambient temperature.Warm up effect: During the warmup time the illuminance doesn’t vary significantly (< 5 %).During the warmup time the power doesn’t vary significantly (< 5 %). The variation in efficacy (calculated as indication by simplydividing the illuminance by the power) during the warming up is -1 %. A very high negative value indicates a significant decrease for instance due to heating up of the lamp (decrease of lifetime). At the end of the article an additional photo. |
|
| Eff-variation | -1 % | This is the variation in efficacy (calculated as indication by simply dividing the illuminance by the power) during the warming up. A very high negative value indicates a significant decrease for instance due to heating up of the lamp (decrease of lifetime). |
| Dimmable | yes | Info from manufacturer. |
Biologic effect factor |
0.641 | According to pre-norm DIN V 5031-100:2009-06. |
| Blue Light Hazard risk group | 0 | 0=exempt, 1=low, 2 = moderate, 3=high risk. |
| form factor | panel | |
| Eulumdat file (3000 K + 6000 K) |  |
Right click on icon and save the file. |
| IES file (3000 K + 6000 K) | |
Right click on icon and save the file. |
| Eulumdat file (3000 K) | |
Right click on icon and save the file. |
| IES file (3000 K) | |
Right click on icon and save the file. |
| Eulumdat file (6000 K) | |
Right click on icon and save the file. |
| IES file (6000 K) | |
Right click on icon and save the file. |
Overview table

Please note that this overview table makes use of calculations, use this data with care as explained on the OliNo site. E (lux) values are not accurate, when within 5 x 735 mm (maximal luminous size, eventually diagonally measured)= 3675 mm. Within this distance from the lamp (data given in red), the measured lux values will be less than the computed values in this overview as the measurements are then within the near field of the lamp.
EU 2013 Energy label classification
Since Sept 2013 these labels will be needed.
Important for the energy classification are the corrected rated power and the useful luminous flux.
The measured rated power is 68.6 W and might need to be corrected. The correction is dependent from the lamp type and whether or not the lamp control gear is included or not. The choice for this lamp is the following classification: Lamps with own control gear (external or internal). As a result the corrected rated power becomes: 68.6 W.
The luminous flux measured is 6228 lm. The classification of this lamp needed to determine the useful flux is: Non-directional lamps. Then the useful flux becomes 6228 lm. Now a reference power can be calculated.
The energy efficiency coefficient is P_corr / P_ref = 0.15.

EU energy label for this lamp

Zip file with 6 EU energy labels of this lamp

The lamp’s performance in the lumen-Watt field, with the energy efficacy fields indicated.
Eulumdat light diagram
This light diagram below comes from the program Qlumedit, that extracts these diagrams from an Eulumdat file.
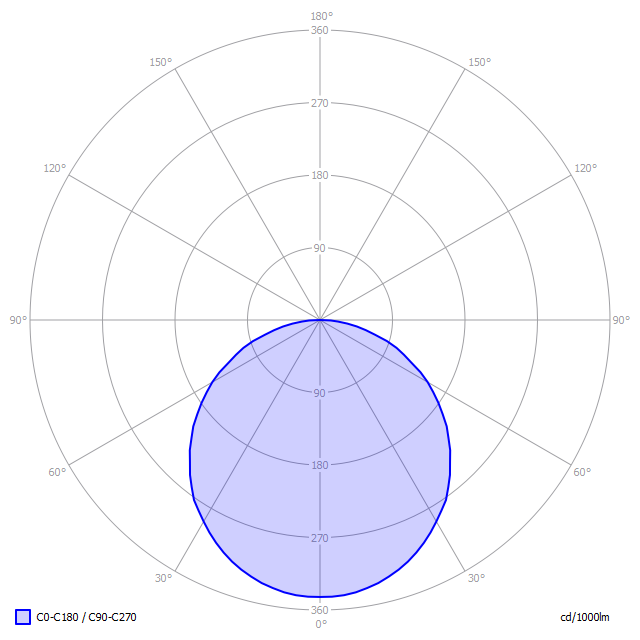
The light diagram giving the radiation pattern.
The light diagram indicates the beam in the C0-C180 plane and in the plane perpendicular to that, the C90-C270 plane. These beams are equal as the lamp has symmetry over its first axis (the vertical axis).
Illuminance Ev at 1 m distance, or luminous intensity Iv
Herewith the plot of the averaged luminous intensity Iv as a function of the inclination angle with the light bulb.

The radiation pattern of the light bulb.
This radiation pattern is the average of the light output of the light diagram given earlier. Also, in this graph the luminous intensity is given in Cd.
These averaged values are used (later) to compute the lumen output.

Intensity data of every measured turn angle at each inclination angle.
This plot shows per inclination angle the intensity measurement results for each turn angle at that inclination angle. There normally are differences in illuminance values for different turn angles. However for further calculations the averaged values will be used.
When using the average values per inclination angle, the beam angle can be computed, being 113 deg for the C0-C180 plane and 113 deg for the C90-C270 plane.
Luminous flux
With the averaged illuminance data at 1 m distance, taken from the graph showing the averaged radiation pattern, it is possible to compute the luminous flux.
The result of this computation for this light spot is a luminous flux of 6228 lm.
Luminous efficacy
The luminous flux being 6228 lm, and the consumed power of the lamp being 68.6 Watt, results in a luminous efficacy of 91 lm/Watt.
Electrical properties
The power factor is 0.95. An electrical load with this power factor means that for every 1 kWh net energy consumed, there has been 0.33 kVAhr for reactive energy.
| Lamp voltage | 230.04 V |
| Lamp current | 0.315 A |
| Power P | 68.6 W |
| Apparent power S | 72.4 VA |
| Power factor | 0.95 |
Of this lamp the voltage across and the resulting current through it are measured and graphed.

Voltage across and current through the lightbulb
This current waveform has been checked on requirements posed by the norm IEC 61000-3-2:2006 (including up to A2:2009).

Harmonics in the current waveform and checked against IEC61000-3-2:2006 and A2:2009
When the consumed power is 25 W there are limits for the harmonics and those are fulfilled.
The Total Harmonic Distortion of the current is computed and its value is 5 %.
Temperature measurements lamp
Temperature image(s).
| status lamp | 2 hours on |
| ambient temperature | deg C |
| reflected background temperature | deg C |
| camera | Flir T335 |
| emissivity | |
| measurement distance | m |
| IFOVgeometric | 0.136 mm per 0.1 m distance |
| NETD (thermal sensitivity) | 50 mK |
Color temperature and Spectral power distribution

The spectral power distribution of this light bulb, energies on y-axis valid at 1 m distance.
The measured color temperature is 4314 K which is neutral white.
This color temperature is measured straight underneath the light bulb. Below a graph showing the color temperature for different inclination angles.

Color temperature as a function of inclination angle.
The color temperature is given for inclination angles up to 90 deg. Beyond that angle has not been measured.
For the C0-C180 plane: the beam angle of 113 deg is equivalent to 56.5 deg inclination angle,which is the area where most of the light falls within. The maximum variation of color temperature in the first 90 degrees of this inclination area is about 1 %.
For the C90-C270 plane: the beam angle of 113 deg is equivalent to 56.5 deg inclination angle,which is the area where most of the light falls within. The maximum variation of color temperature in the first 90 degrees of this inclination area is about 1 %.
PAR value and PAR spectrum
To make a statement how well the light of this light bulb is for growing plants, the PAR-area needs to be determined.

The photon spectrum, then the sensitivity curve and as result the final PAR spectrum of the light of this light bulb
| parameter | value | unit |
|---|---|---|
| PAR number | 20.5 | uMol/s/m^2 |
| PAR photon current | 59.6 | uMol/s |
| PAR photon efficacy | 0.9 | uMol/s/W |
The PAR efficiency is 65 % (valid for the PAR wave length range of 400 – 700 nm). This is the maximum percentage of the total of photons in the light that is effectively used by the average plant (since the plant might not take 100 % of the photons at the frequency where its relative sensitivity is 100 %).
S/P ratio

The power spectrum, sensitivity curves and resulting scotopic and photopic spectra (spectra energy content defined at 1 m distance).
The S/P ratio of the light coming from this lamp is 1.9.
Chromaticity diagram

The chromaticity space and the position of the lamp’s color coordinates in it.
The point of the light in this diagram is inside the area indicated with class A. This area indicates an area for signal lamps.
The color coordinates are x=0.3590 and y=0.3656.
Color Rendering Index (CRI) or also Ra
Herewith the image showing the CRI as well as how well different colors are represented (rendered). The higher the number, the better the resemblance with the color when a black body radiator would have been used (the sun, or an incandescent lamp)
Each color has an index Rx, and the first 8 indexes (R1 .. R8) are averaged to compute the Ra which is equivalent to the CRI.

CRI of the light of this lightbulb.
This value of 86 indicates how well the light of this lamp can render well a set of reference colors, this in comparison with the light of a reference source (for color temperatures 5000K a black radiator is used as reference and for color temperatures 5000K the sun or the light outside during the day).
The value of 86 is bigger than the value of 80 that is considered as a minimum for working areas in general.
Note: the chromaticity difference is -0.0039 and indicates the distance to the Planckian Locus. There is a value mentioned of max 5.4E-3 in section 5.3 of CIE 13.3-1995 however not further explanation of it.
An other reference with signal lights as a reference is given in the chromaticity diagram.
Color Quality Scale
QCS (v9.0.3) is an improved indicator (over CRI) of how well colors are rendered.

CQS-values of the light of this light bulb.

CQS-values for the light of this light bulb compared with those of a reference source with the same color temperature.
Warm up effects
After switch on of a cold lamp, the effect of heating up of the lamp is measured on illuminance E_v [lx], the lamppower P [W] and the luminous efficacy [lm/W].


Effect of warming up on different light bulb parameters. In the first graph the 100 % level is put at begin, and in the last graph the 100 % level is put at the end.
During the warmup time the illuminance doesn’t vary significantly ( 5 %).
During the warmup time the power doesn’t vary significantly ( 5 %).
The variation in efficacy (calculated as indication by simplydividing the illuminance by the power) during the warming up is -1 %. A very high negative value indicates a significant decrease for instance due to heating up of the lamp (decrease of lifetime).
Biologic effect
The biologic effect shows the level of impact the light of this lamp can have on the day-night rhythm of human beings (as well as the suppression of melatonin production).
The important parameters (according to prenorm DIN V 5031-100:2009-06):
| biologic effect factor | 0.641 |
| kbiol trans (25 years) | 1.000 |
| kbiol trans (50 years) | 0.758 |
| kbiol trans (75 years) | 0.491 |
| kpupil(25 years) | 1.000 |
| kpupil(50 years) | 0.740 |
| kpupil(75 years) | 0.519 |
Blue Light Hazard
The amount of blue light and the harm it can cause on the retina has been determined. Herewith the results.

The level of blue light of this lamp related to the exposure limit and the different classification areas.
| L_lum0 [mm] | 520 | Dimension of brightest part of lamp in C0-C180 direction. |
| L_lum90 [mm] | 520 | Dimension of brightest part of lamp in C90-C270 direction. |
| SSD_500lx [mm] | 2069 | Calculated distance where Ev = 500 lux. This computation is valid when it is in the far field of the lamp. Note: if this value 200 mm then the distance of 200 mm is taken as proposed in the norm IEC 62471:2006. |
| Start of far field [mm] | 3677 | Minimum distance at which the lamp can be seen as apoint source. In this area the Ev is linearly dependent from (1/distance)2. |
| 300-350 nm values stuffed with 0s | yes | In the event OliNo has measured with a SpB1211 spectrometer without UV option then the irradiance data of 300-349 nm is missing. For lamps where there is already no energy content near 350 nm, the values 300-349 can also be set at zero then. |
| alphaC0-C180 [rad] | 0.251 | (Apparent) source angle in C0-C180 direction. |
| alphaC90-C270 [rad] | 0.251 | (Apparent) source angle in C90-C270 direction. |
| alphaAVG [rad] | 0.100 | Average (apparent) source angle. If average >= 0.011 rad then the exposure limit is computed with radiance Lb. Otherwise with irradiance Eb. |
| Exposure value [W/m^2/sr] | 5.88E+0 | Blue Light Hazard value for this lamp, measured straight underneath the lamp. Computation is referenced to Lb. Because the distance at 500 lux is in the near field, then this exposure value is too pessimistic and should be lower. |
| Blue Light Hazard risk group | 0 | 0=exempt, 1=low, 2 = moderate, 3=high risk. |
Extra


Additional photos.
Lamp Portal


Oil Price
WTI Crude Oil

