LokoLED – LED grow light Groei/bloei 36W
Posted by Marcel van der Steen in Light measurements Add comments![]() LokoLED presents a plant grow light. The lamp consumes 24.5 W and has a luminous flux of 302 lm or 21.1 micromol/s. This results in an efficacy of 12 lm/W or 1.3 micromol/s.
LokoLED presents a plant grow light. The lamp consumes 24.5 W and has a luminous flux of 302 lm or 21.1 micromol/s. This results in an efficacy of 12 lm/W or 1.3 micromol/s.
This article shows the measurement results. Many parameters are also found in the Eulumdat file.
See this overview for a comparison with other light bulbs.
Summary measurement data
| parameter | meas. result | remark |
|---|---|---|
| Luminous intensity Iv | 109.4 Cd | Measured straight underneath the lamp. |
| Illuminance modulation index | 23 % | Measured with a light sensor looking at the lamp (angle not defined). Is a measure for the amount of flickering. |
| Beam angle | 126 deg | 106 deg is the beam angle for the C0-C180-plane (perpendicular to the length direction of the lamp) and 126 deg is the beam angle for the C90-C270 plane, which is along the length direction of the lamp. |
| Power P | 24.5 W | Follow the link for more information on electrical properties. |
| Power Factor | 0.86 | An electrical load with this power factor means that for every 1 kWh net energy consumed, there has been 0.60 kVAhr for reactive energy. |
| THD | 17 % | Total Harmonic Distortion. |
| Max inrush current | 5.025 A | This current has been found at a voltage start angle of 90 degrees. |
| Luminous flux | 302 lm | Measured with photogoniometer, calculation done as described in LM79-08. |
| Luminous efficacy | 12 lm/W | |
| Fitting | 230V | This lamp is connected directly to the grid voltage. |
| Photon current | 32.1 uMol/s | The total number of photons in the light of this lamp. |
| L x W x H external dimensions | 1198 mm x 35 mm x 38 mm | External dimensions of the lamp. |
| L x W luminous area | 1140 mm x 20 mm | Dimensions of the luminous area (used in Eulumdat file). It is the white surface on which the leds are mount. |
| General remarks | The ambient temperature during the whole set of illuminance measurements was 26.5 – 28.1 deg C.The temperature of the housing gets maximally about 13 degrees hotter than ambient temperature. Warm up effect: During the warmup time the illuminance varies during 32 minutes and decreases with 13 %. During the warmup time the power doesn’t vary significantly ( 5 %). the variation in efficacy during the warming up is -9 %. A very high negative value indicates a significant decrease for instance due to heating up of the lamp (decrease of lifetime).Voltage dependency: There is no (significant) dependency of the illuminance when the power voltage varies between 200 – 250 V AC. There is no (significant) dependency of the consumed power when the power voltage varies between 200 – 250 V AC.At the end of the article an additional photo. |
|
| Eff-variation | -9 % | This is the variation in efficacy during the warming up. A very high negative value indicates a significant decrease for instance due to heating up of the lamp (decrease of lifetime). |
| Dimmable | no | Info from manufacturer. |
| Eulumdat file |  |
Right click on icon and save the file. |
| Eulumdat file (instead of lumens now micromol/s) | |
Right click on icon and save the file. |
Overview table

The overview table is explained on the OliNo website.
Please note that this overview table makes use of calculations, use this data with care as explained on the OliNo site. E (lux) values are not accurate, when within 5 x 1140 mm (maximal luminous size, eventually diagonally measured)= 5700 mm. Within this distance from the lamp (data given in red), the measured lux values will be less than the computed values in this overview as the measurements are then within the near field of the lamp.
Eulumdat light diagram
This light diagram below comes from the program Qlumedit, that extracts these diagrams from an Eulumdat file. This light diagram is explained on the OliNo site.
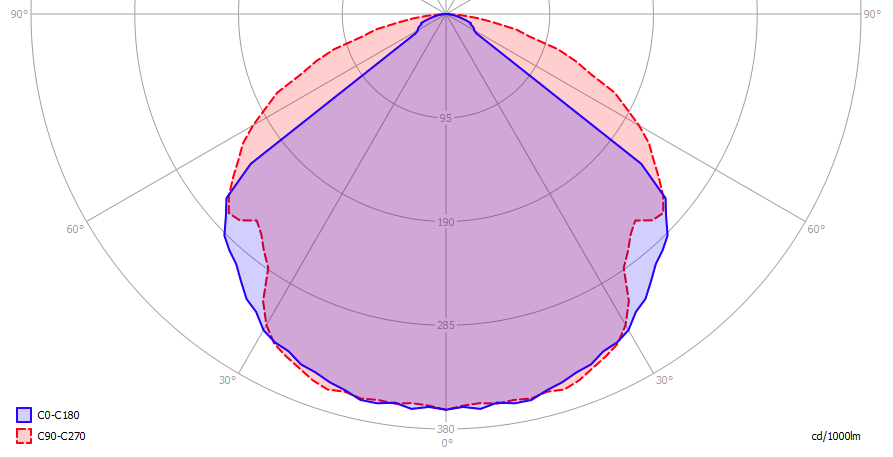
The light diagram giving the radiation pattern.
The light diagram indicates the beam in the C0-C180 plane (perpendicular to the length direction of the lamp) and in the plane perpendicular to that, the C90-C270 plane (along the length direction of the lamp).
Illuminance Ev at 1 m distance, or luminous intensity Iv
Herewith the plot of the averaged luminous intensity Iv as a function of the inclination angle with the light bulb.

The radiation pattern of the light bulb.
This radiation pattern is the average of the light output of the light diagram given earlier. Also, in this graph the luminous intensity is given in Cd.
These averaged values are used (later) to compute the lumen output.

Intensity data of every measured turn angle at each inclination angle.
This plot shows per inclination angle the intensity measurement results for each turn angle at that inclination angle. There normally are differences in illuminance values for different turn angles. However for further calculations the averaged values will be used.
When using the average values per inclination angle, the beam angle can be computed, being 106 deg for the C0-C180 plane and 126 deg for the C90-C270 plane.
Luminous flux
With the averaged illuminance data at 1 m distance, taken from the graph showing the averaged radiation pattern, it is possible to compute the luminous flux.
The result of this computation for this light spot is a luminous flux of 302 lm.
Luminous efficacy
The luminous flux being 302 lm, and the consumed power of the lamp being 24.5 Watt, results in a luminous efficacy of 12 lm/Watt.
Electrical properties
The power factor is 0.86. An electrical load with this power factor means that for every 1 kWh net energy consumed, there has been 0.60 kVAhr for reactive energy.
| Lamp voltage | 230.23 V |
| Lamp current | 0.124 A |
| Power P | 24.5 W |
| Apparent power S | 28.6 VA |
| Power factor | 0.86 |
Of this lamp the voltage across and the resulting current through it are measured and graphed. See the UI acquisition on the OliNo site how this is obtained.

Voltage across and current through the lightbulb
This current waveform has been checked on requirements posed by the norm IEC 61000-3-2:2006 (including up to A2:2009). See also the IEC 61000-3-2:2006 explanation on the OliNo website.

Harmonics in the current waveform and checked against IEC61000-3-2:2006 and A2:2009
When the consumed power is = 25 W there are no limits for the harmonics.
The Total Harmonic Distortion of the current is computed and its value is 17 %.
Inrush current
The inrush current has been measured for different voltage start angles; from 0 – 170 degrees with a 10 degrees step. The current- and voltage values have been acquires at a sample speed of 39.9 kS/s. Then this data has been fed into a second order 2kHz low pass Butterworth filter. This removes the current spikes that do not represent relevant values.
The lamp was two minutes off before every inrush current measurement was made.
| Test voltage | 230.0 V | |
| Frequency of the voltage | 50.0 Hz | |
| Maximum inrush current | 5.025 A | This current has been found at a voltage start angle of 90 degrees. |
| Pulse width of max inrush current | 1.5E-4 s | This is the time that the pulse is higher than 66 % of the max inrush current. |
| Minimal inrush current | 0.297 A | This current has been found at a voltage start angle of 0 degrees. |
| I^2 x t after 10 ms at 0 deg voltage start angle | 2.030E-4 A | This is the I^2 t value when a zero crossing detector is used to start the voltage from 0 degrees. |

Inrush current found at worst-case voltage start angle

First cycle of the maximum inrush current

The energy I2t during the first 10 ms of the first current cycle
Temperature measurements lamp


Temperature image(s).
| status lamp | 2 hours on |
| ambient temperature | 26 deg C |
| reflected background temperature | 26 deg C |
| camera | Flir T335 |
| emissivity | 0.95 |
| measurement distance | 1.0, 1.5 m |
| IFOVgeometric | 0.136 mm per 0.1 m distance |
| NETD (thermal sensitivity) | 50 mK |
Spectral power distribution
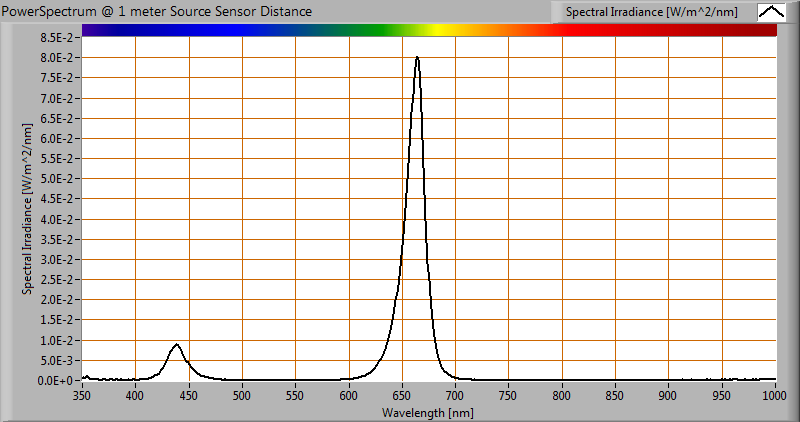
The spectral power distribution of this light bulb, energies on y-axis valid at 1 m distance.
Voltage dependency
The dependency of a number of lamp parameters on the lamp voltage is determined. For this, the lamp voltage has been varied and its effect on the following light bulb parameters measured: illuminance E_v [lx], the lamppower P [W] and the luminous efficacy [lm/W] (this latter is estimated here by dividing the found E_v value by P).

Lamp voltage dependencies of certain light bulb parameters
There is no (significant) dependency of the illuminance when the power voltage varies between 200 – 250 V AC.
There is no (significant) dependency of the consumed power when the power voltage varies between 200 – 250 V AC.
When the voltage varies abruptly with + or – 5 V AC then this results in a variation of the illuminance of maximally 0.0 %. This difference in illuminance is not visible (when it occurs abruptly).
Warm up effects
After switch on of a cold lamp, the effect of heating up of the lamp is measured on illuminance E_v [lx], the lamppower P [W] and the luminous efficacy [lm/W].


Effect of warming up on different light bulb parameters. In the first graph the 100 % level is put at begin, and in the last graph the 100 % level is put at the end.
During the warmup time the illuminance varies during 32 minutes and decreases with 13 %.
During the warmup time the power doesn’t vary significantly ( 5 %).
the variation in efficacy during the warming up is -9 %. A very high negative value indicates a significant decrease for instance due to heating up of the lamp (decrease of lifetime).
Measure of flickering
An analysis is done on the measure of flickering of the light output by this light bulb. See the article on flickering on OliNo site for more information.

The measure of fast illuminance variation of the light of the light bulb
| parameter | value | unit |
|---|---|---|
| Flicker frequency | 100.0 | Hz |
| Illuminance modulation index | 23 | % |
The illuminance modulation index is computed as: (max_Ev – min_Ev) / (max_Ev + min_Ev).
Extra

Additional photos.


Most popular posts